smartTomo 2025.0 released

We are pleased to announce the release of SmartTomo 2025.0 ‘Punta Marguareis’! This new version represents a major step forward in the development of seismic refraction tomography, introducing seismic attenuation tomography.

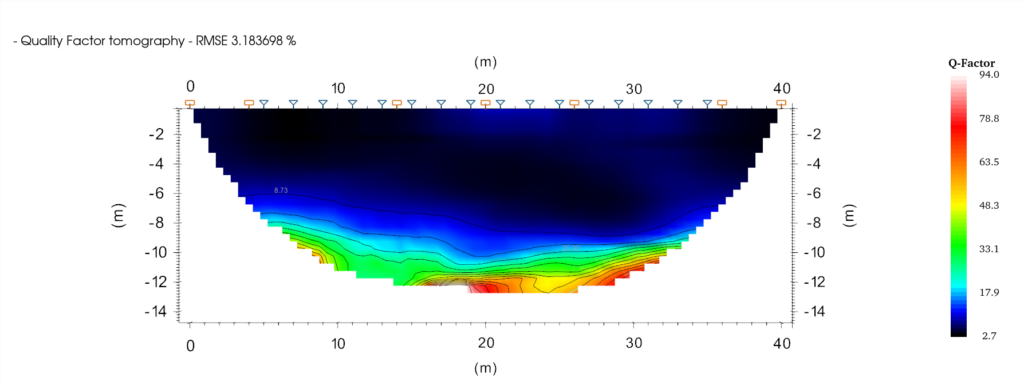
Attenuation and Q-Factor tomography

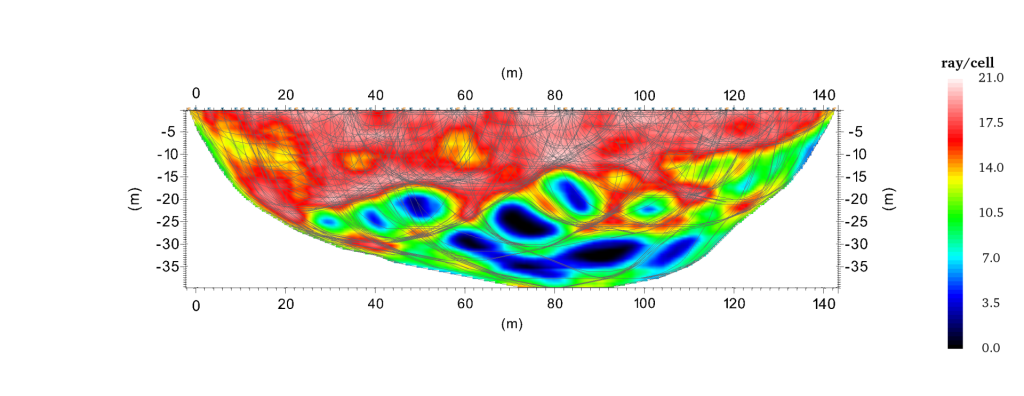
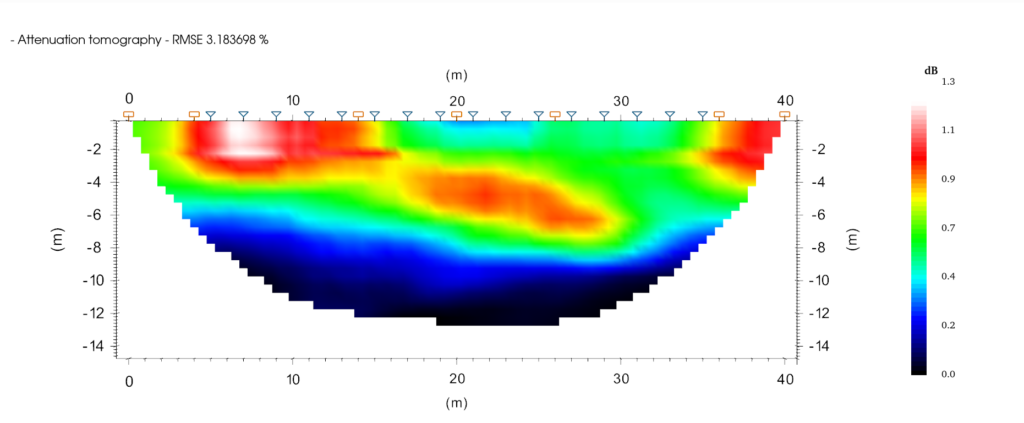
The latest version introduces a significant step forward in seismic refraction tomography processing by including seismic attenuation tomography.

This new processing enables seismic attenuation and Q-Factor tomography by analysing how the energy of the refracted signal attenuates along the profile. The signal intensity is sampled within a defined window around the first arrival, which can be selected manually track by track.

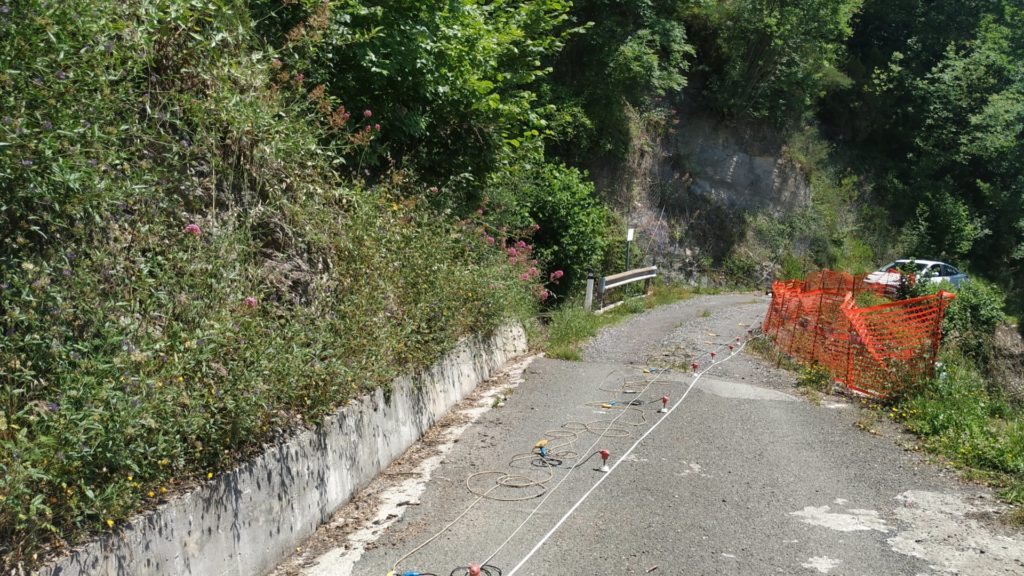
This type of analysis is complementary to traditional seismic wave velocity tomography and provides additional information on subsurface properties. However, for the results to be reliable, it is essential to avoid the introduction of artificial and variable attenuation factors, such as unevenly installed geophones (some set in the ground, others placed on rigid surfaces such as asphalt) or different gains between acquisition channels.

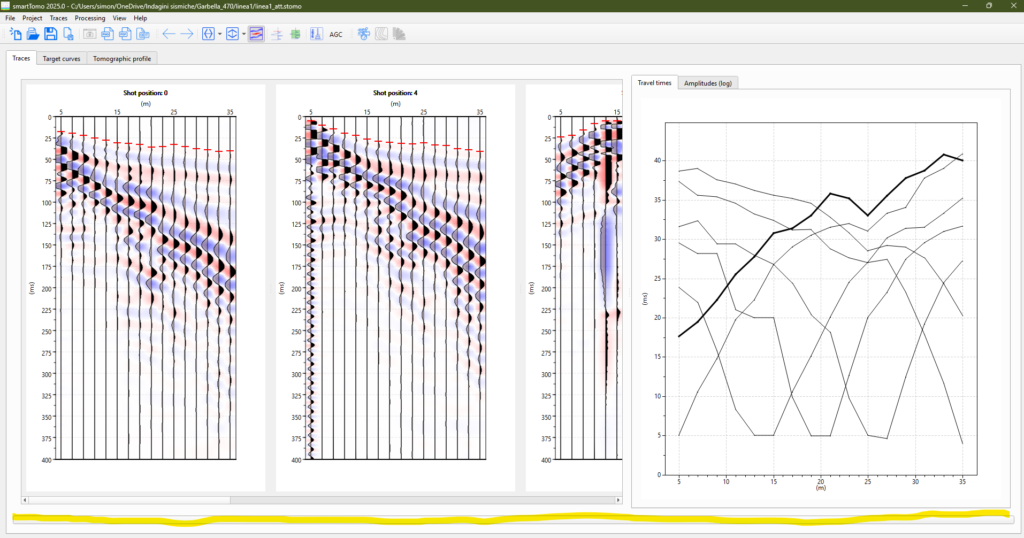
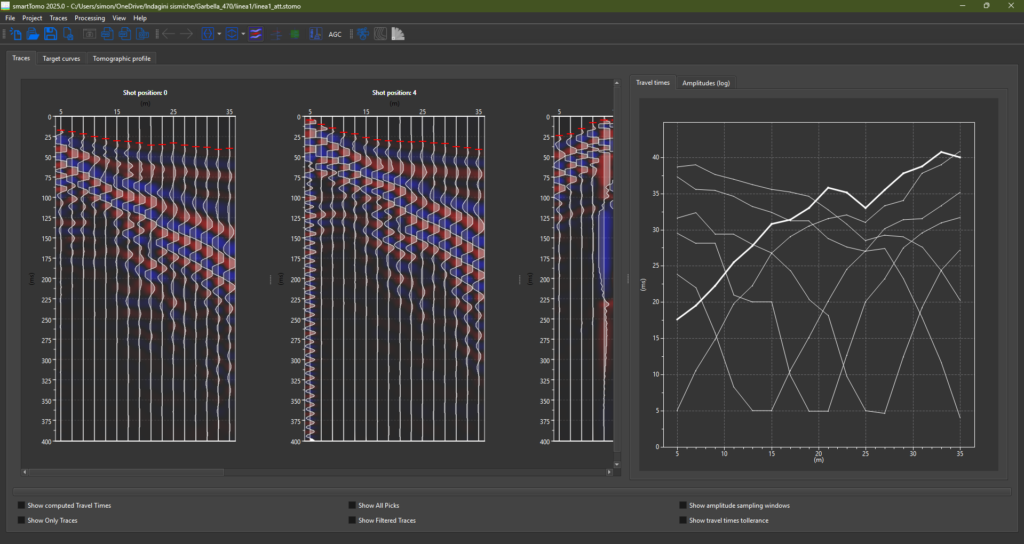
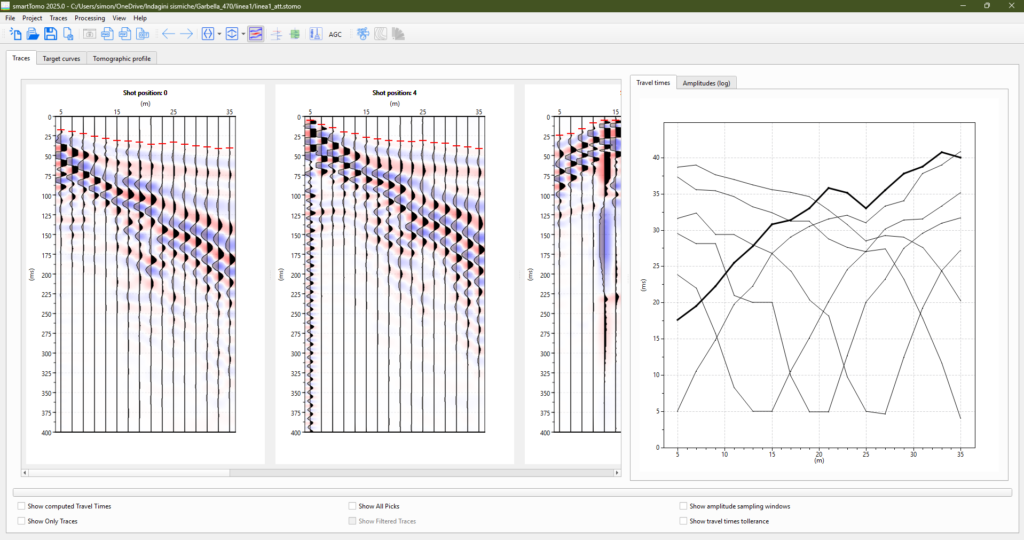
New visualisation of seismic traces

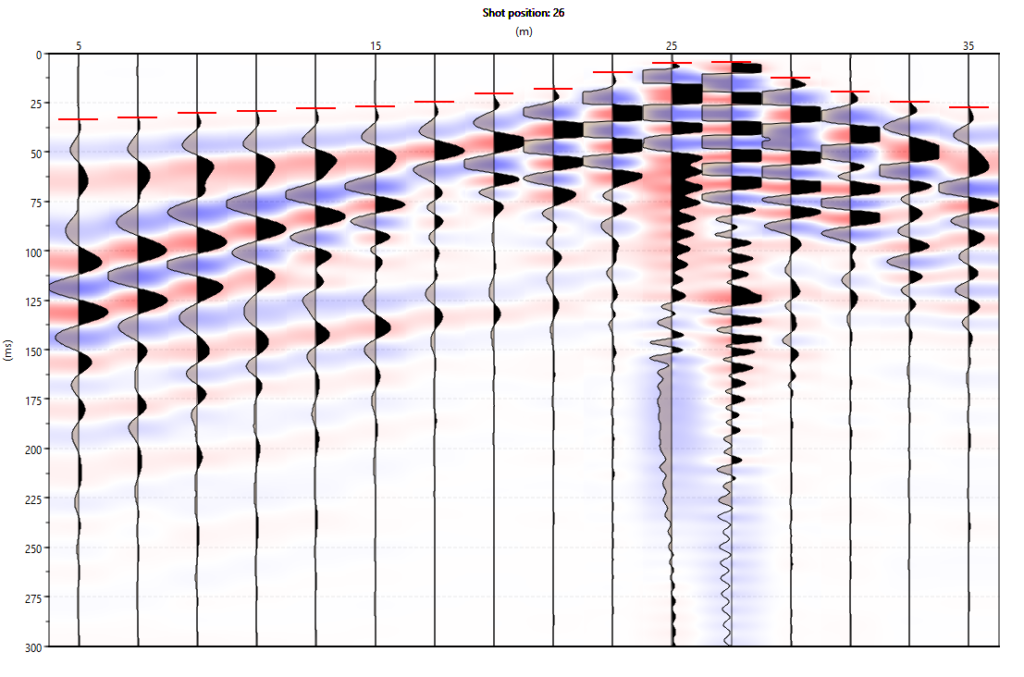
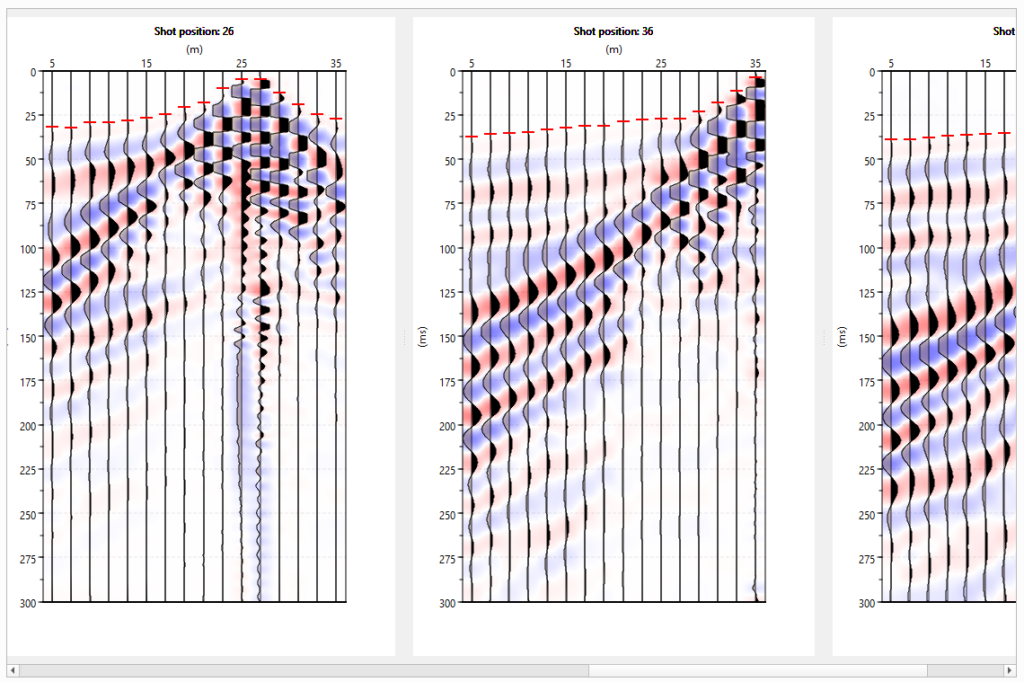
Seismic traces can now be displayed together with the signal intensity map to better highlight waveforms.

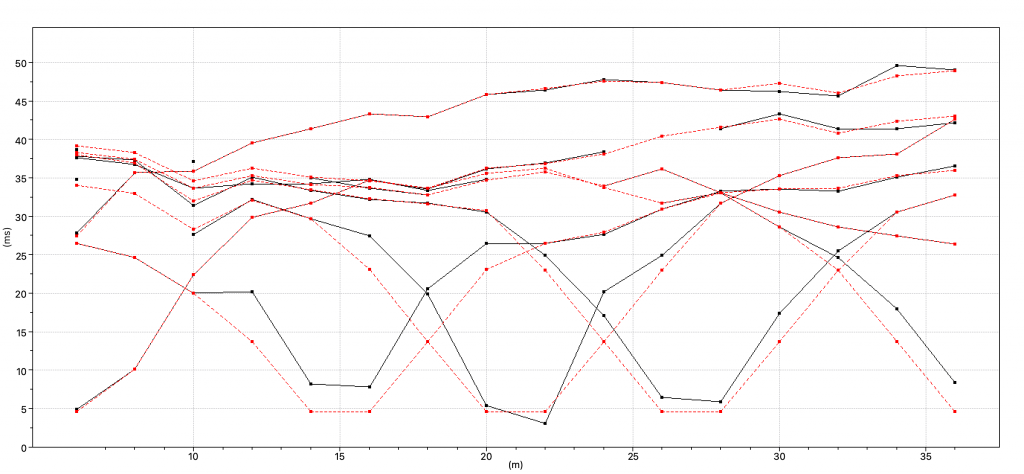
Editing dei tempi di arrivo

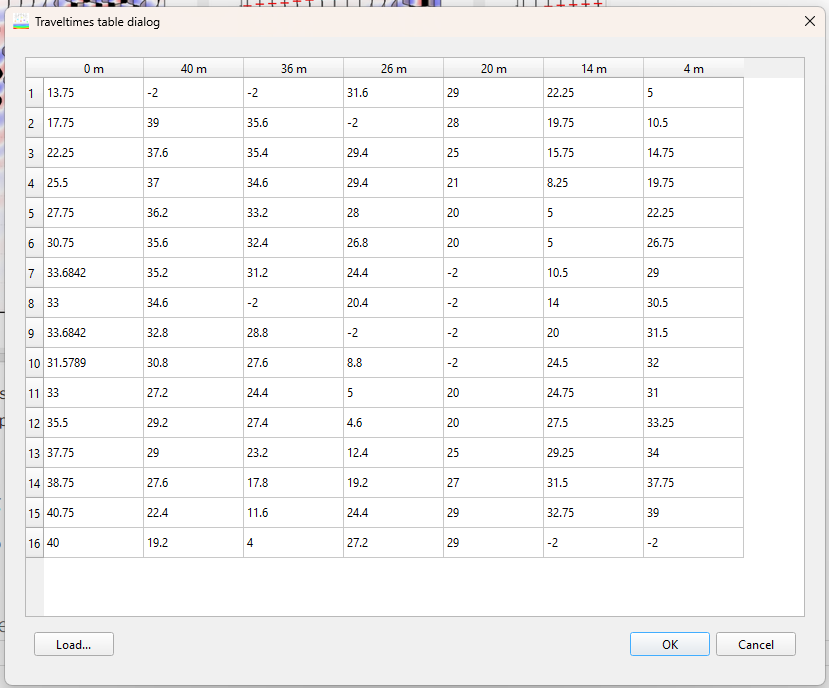
From this version, it is possible to display, copy and paste first-arrival times into a table showing measured values expressed in milliseconds. This function then allows the first arrival times to be edited manually for more accurate identification.
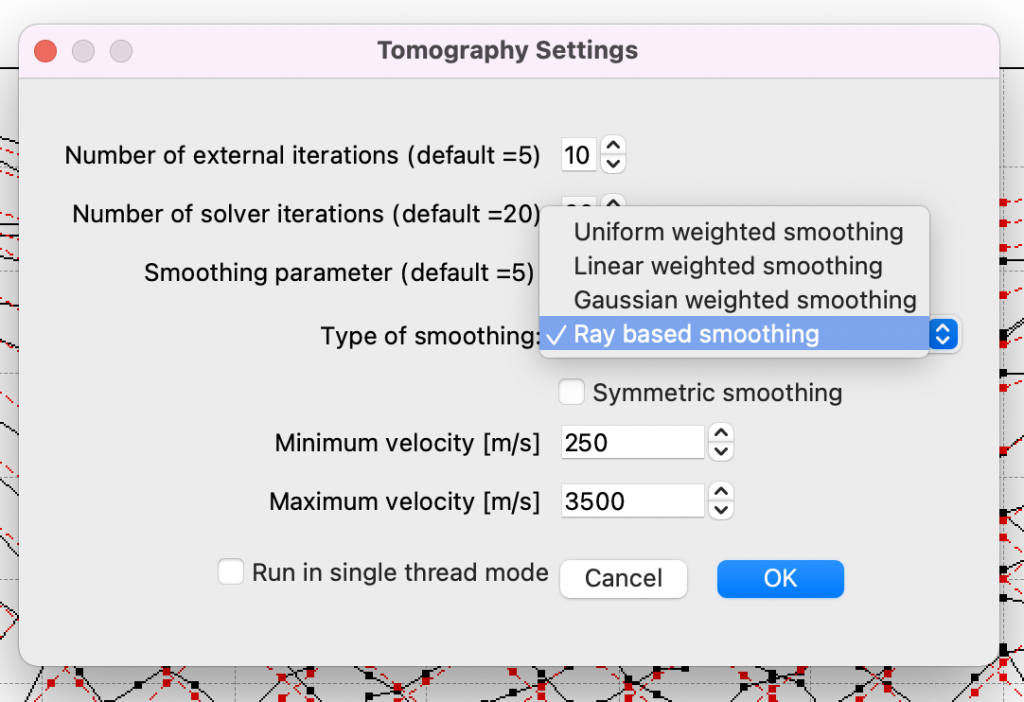
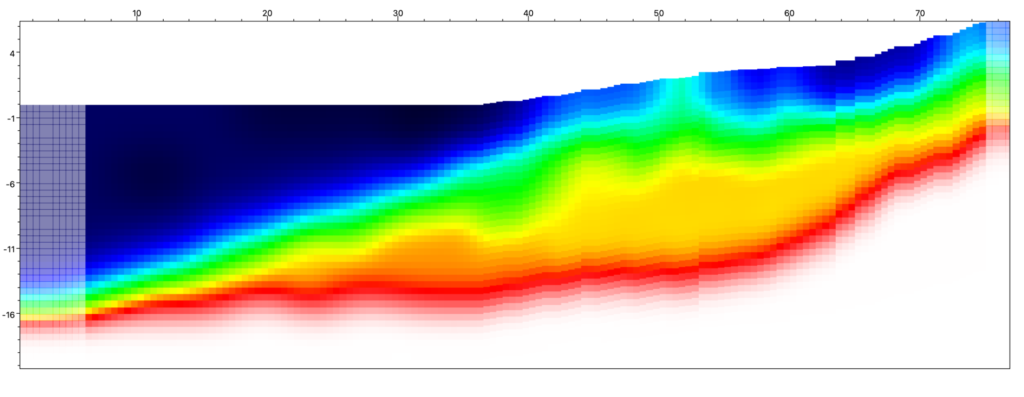
Smoothing parameter

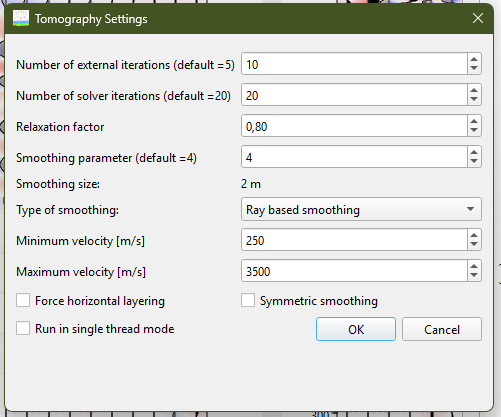
The smoothing parameter, previously expressed in number of cells, is now converted to its equivalent in metres. This update provides a more intuitive and immediate indication of the effect of smoothing on the profile, making it easier to adjust the parameter according to the size of the area under investigation and improving the interpretation of results.

Dark/light themes

Now smartTomo can be run in light or dark mode or be automatically set to match the style of the desktop.

Undo last processing

This version introduce the undoing of the last tomography processing allowing user goes back to the previous tomographic model.

Hide/show the bottom tool widget

Release notes of SmartTomo 2022.0

Spalshscreen of smartTomo

We are happy to announce the release of the new version of SmartTomo, the best version to date.
The new version includes improvements in seismic tomography processing, profile visualization, and new result export options, in addition to the inevitable bugfixes.

Seismic tomography processing

This image has an empty alt attribute; its file name is immagine-1024x702.png

A new seismic ray-based smoothing mode has been added. This new smoothing method uses only the velocity value of the cells crossed by the seismic rays. The velocity distribution function follows a law based on the speed of the seismic waves giving more continuity where the speed is higher. This smoothing allows for more velocity variation in the superficial layers and a relatively smoother profile at deeper depths.

Profile visualization

Seismic Profile with Grid and Title - SmartTomo 2022
Seismic Profile with Grid and Title – SmartTomo 2022

The profile visualization module has received several improvements.
It is now possible to assign a title to the profile that will be displayed at the top of the view. In addition to the name, the view type and the RMSE error of the simulation are shown. The title and RMSE error will be saved in the project so that they can be recalled when opening the project again.

Dialog to set the title in smartTomo
Set the title

The profile can now be displayed also with a grid overlay corresponding to the major intervals shown on the axes.

Information Density Level Viewer

This image has an empty alt attribute; its file name is immagine-1-1024x396.png
View of the Information Density Level

In SmartTomo 2022 a new way of displaying the results has been added: the information density layer. This layer is intended to represent how much each individual cell was affected during model reconstruction. Higher values correspond to cells whose value has been determined by a larger number of measured data (equations) always taking into account that the tomographic inversion process is an optimization of the model and not an exact solution.
This visualization then allows you to assess whether the tomographic model in a given area has been updated and with how many constraints.

Export of results

Seismic profile exported in KML and shown in Google Earth
Profile exported to KML and displayed in Google Earth

SmartTomo 2022 introduces the possibility to export results in KML format for visualization in external tools such as Google Earth. For the export it is necessary that the seismic profile is georeferenced (first and last geophone) and that the coordinate system EPSG code is defined.

This image has an empty alt attribute; its file name is Schermata-2021-11-24-alle-17.50.26-1024x540.png
Geopositioning and energization exported in KML and visualized in Google Earth
This image has an empty alt attribute; its file name is Schermata-2021-11-02-alle-19.10.58.png
Setting of coordinates in a projected reference system like UTM

smartTomo 2020.2 has been released

Version 2020.2 has been released and it introduces some visualization improvements. Now the dromocrons can be displayed in only two colors instead of the standard multicolor mode.
Exporting the profile from the screenshot has been improved. It is now possible to get a screenshot at a higher resolution than the screen resolution (if supported by the video card)
Screenshot capture is now also enabled for dromchrone display.

This image has an empty alt attribute; its file name is Dromocrone_2_colori-1024x474.png
The 2-color dromchrone offers a better visualization of the differences between calculated and measured times.

Case study – Model of alluvial deposits at the foot of a slope

Introduction

SmartTomo’s ability to process complex refraction tomographic profiles is tested using data computed on synthetic velocity models. The synthetic velocity model represents a geologic model sketched with the characteristics to be tested. The synthetic model is used to simulate a refraction seismic acquisition by recording arrival times at the geophone location. The recorded data will be used to perform tomographic processing in order to compare the tomographic result with the synthetic geological model (groundtruth).

Continue reading “Case study – Model of alluvial deposits at the foot of a slope”

Version 2020.1 released

We are pleased to announce the release of smartTomo 2020.1 which includes the bug fixes released so far as individual updates of the previous version.
This version does not introduce new features but more stability of use than ever before

smartTomo 2020.0 released

The SmartTomo 2020.0 version introduces new features and numerous bug fixes compared to previous versions. From this version SmartTomo becomes a full-featured software for refraction seismics by integrating both the tomographic processing with GRM method seismic refraction. Now within the software it is possible to perform refraction processing and display the refraction profile either separate or overlaid with the tomographic processing.

This image has an empty alt attribute; its file name is Tomografia_smartTomo_2020-1024x414.png
Seismic refraction profile elaborated with smartTomo using GRM procedure

In SmartTomo we give a lot of importance to the ability to display results without the need to use external software. The visualization of the tomographic profile is the means by which specialists interpret the results and therefore it is essential that it is versatile and clear. Version 2020.0 introduces the possibility to choose the size of the geophones display on the profile.
From this version it is possible to compose on screen the view to be exported and save it directly on file obtaining a true copy of the screen. This also allows the creation of focused details of the profile.

In addition SmartTomo from version 2020.0:

  • imports files in seg2, sgy and SU formats;
  • allows you to choose the density of the labels on the isolines avoiding overlapping;
  • export profile screenshots to get enlarged details of the tomographic section.

Results Testing

This version of smartTomo has been tested using a synthetic dataset available on the detectation.com/ forum. It is a 3-layers profile with a slope in the deepest refractor.

Profile of the ground-truth model used to test smartTomo

The dataset has been analyzed with smartTomo obtaining the following profile:

Seismic profile processed using SmartTomo 2020

Case study – Detection of a tunnel.

In this work, seismic refraction tomography (SRT) was performed to investigate the characteristics of the subsoil and to investigate the evidence of the presence of a tunnel used for the carrying of water.

Tomographic profile showing an anomaly in seismic velocity

The survey was carried out using 24 vertical geophones and performing a high number of vertical energizations both inside and outside the line, in order to have a good coverage by seismic rays throughout the section.

Continue reading “Case study – Detection of a tunnel.”